
 |
| Left: The study area, in New York State. Right: Morgan Hill State Forest. The study area is the purple rectangle within the State Forest. |
Morgan Hill State Forest is 5294 acres. Once farmland, the land reverted to the state when the farms were abandoned and between 1929-1931 the land was planted with conifers and native hardwood.
The streams in the study area flow into the eastern branch of the Tioughnioga River, eventually reaching Chesapeake Bay via the Chenango River and the Susquehanna River.
I did some statistical analysis on this data as part of a project for a statistics class, and it was great to have the opportunity to go into more detail on the quantitative assessment of the data I collected and its precision.
 |
| Left: Data collected with a handheld GPS unit. Large circles are waypoints; smaller circles are part of the recorded tracks. Right: The locations of the four transects used to create elevation profiles, the mapped stream locations and orientations (arrows) and the bedrock orientations. Downstream is to the south. |
My field observations suggest there is a relationship between stream orientation and bedrock fractures. This is assuming that the one exposure of fractures (two sets though) is representative of all fractures in the region. The mean orientation of the stream, calculated from the collected orientations shown in the map above, is equal to the orientation of one of the joint sets.
The stream beds were covered in pieces of shale, and in some places they were even imbricated. My interpretation was that these shale pieces were once part of the bedrock but they've been broken up and moved by streams, particularly during spring runoff. Over time, this process widened the valley upstream (see figure below). Downstream, the valley narrows, interpreted to be caused by incision of a more resistant rock than the shales upstream (although not confirmed because the edge of my study area was also the border of the state forest and I didn't want to go onto private land during hunting season). This produced the ridges/terraces observed at the south end of the study area.
 |
| Elevation profiles for the four transects are shown on the left. 5m contours have been added to this map to show the general valley morphology. Recorded elevations for profile C-C' are higher than those upstream and downstream. Contours were not draw through this portion of the map to reflect the uncertainty in this data (this transect was collected when the Garmin battery was low). Downstream is to the south. |
 |
| Photo 1 taken at waypoint 017. Photo 2 taken at waypoint 060. Photo 3 taken at waypoint 045. Photo 4 taken at waypoint 051. Waypoint locations are shown on the map above. |
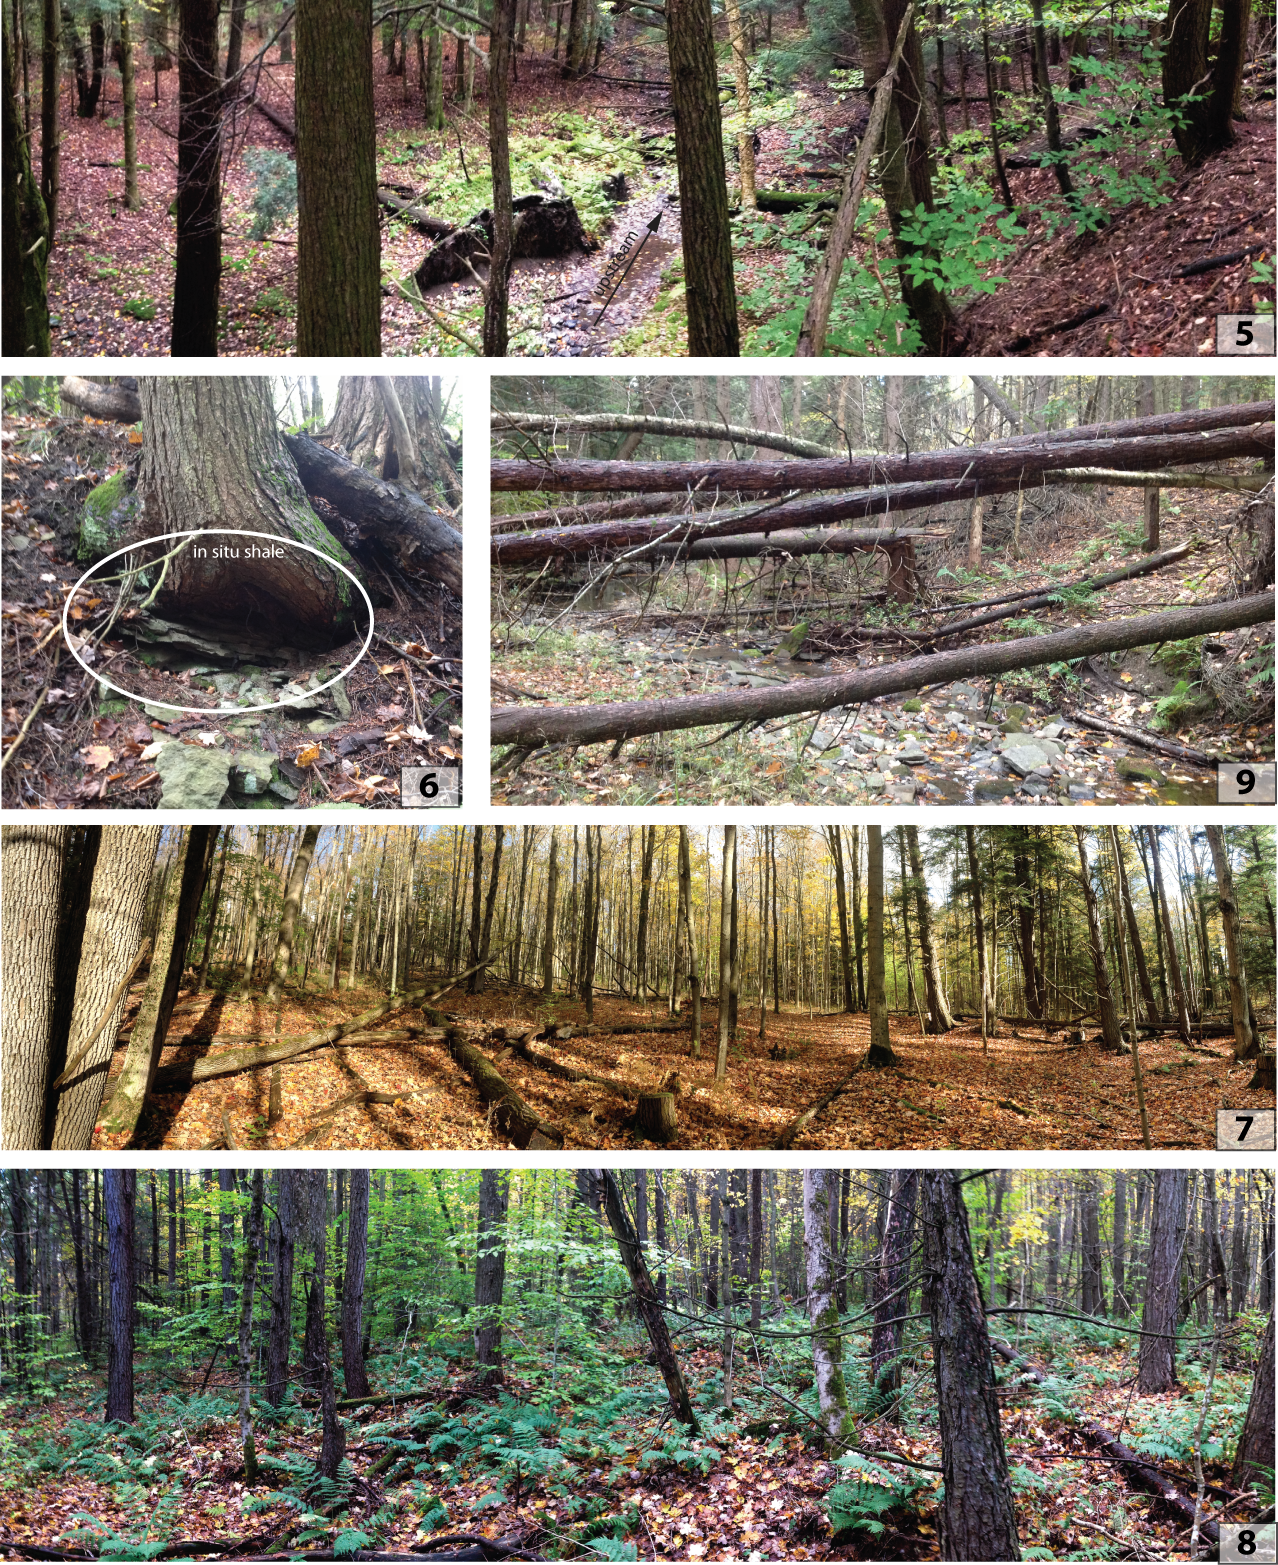 |
| Photo 5 taken at waypoint 022 (standing on ridge). Photo 6 taken at waypoint 047. Photo 7 taken at waypoint 065. Photo 8 taken at waypoint 042. Waypoint locations shown on map above. |
No comments:
Post a Comment