Just outside of Syracuse is Green Lakes State Park. It's a must-see for any geoscientist visiting the area and I've had the pleasure of going several times in the two years I've lived here. The two lakes in the state park are glacial remnants, and if that's not cool enough, Green Lake has reefs.
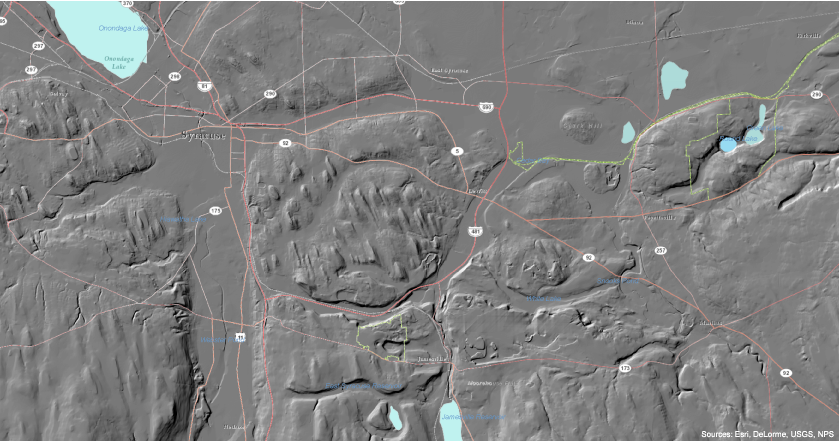 |
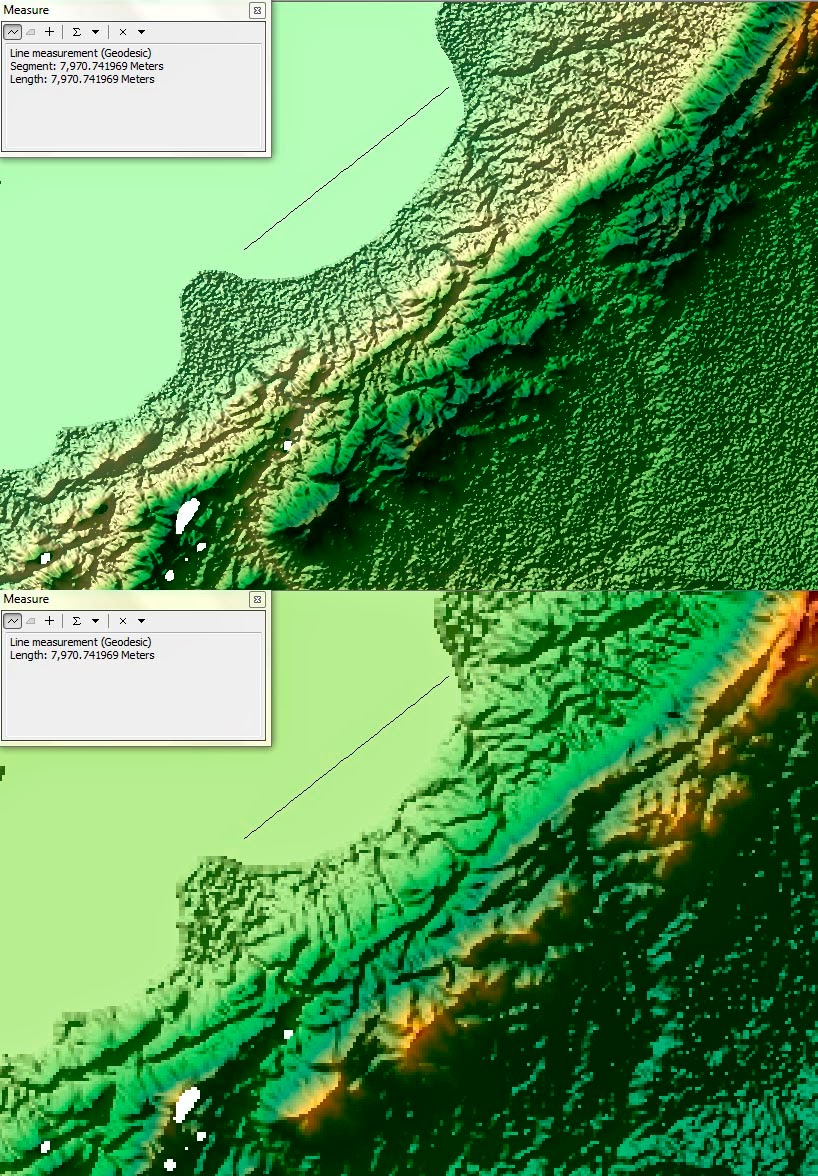
| Digital Elevation Model of the Syracuse region. Green Lakes State Park is on the east (right) side of the map. There are several glacial features evident in this map - most notably the drumlins and the gorge that Green Lake and Round Lake are in (see annotated version below). |
I've written about this type of hillshade map before, in my post "
Hillshades of New York State." That post includes a link to a discussion about drumlins, which are abundant in this part of New York State.
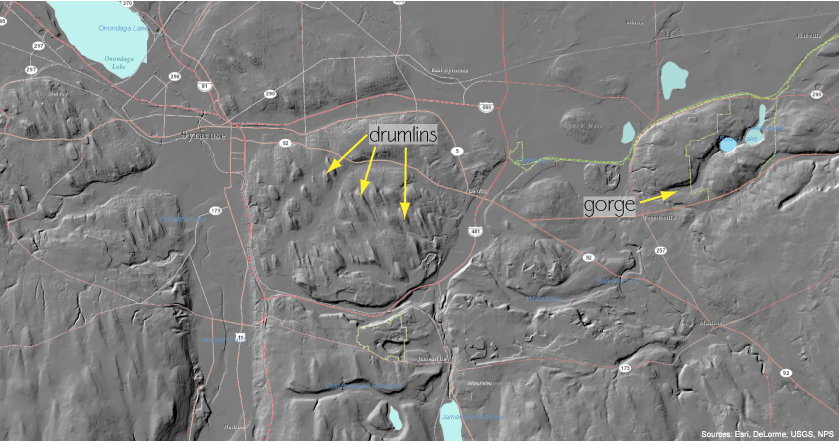 |
| Same map, but with some of the drumlins and the gorge marked. |
Green Lake and Round Lake are small and deep - the gorge they are in was formed by a river and these two lakes may have been plunge pools at the base of large waterfalls (similar to Niagara Falls and the Niagara River Gorge today).
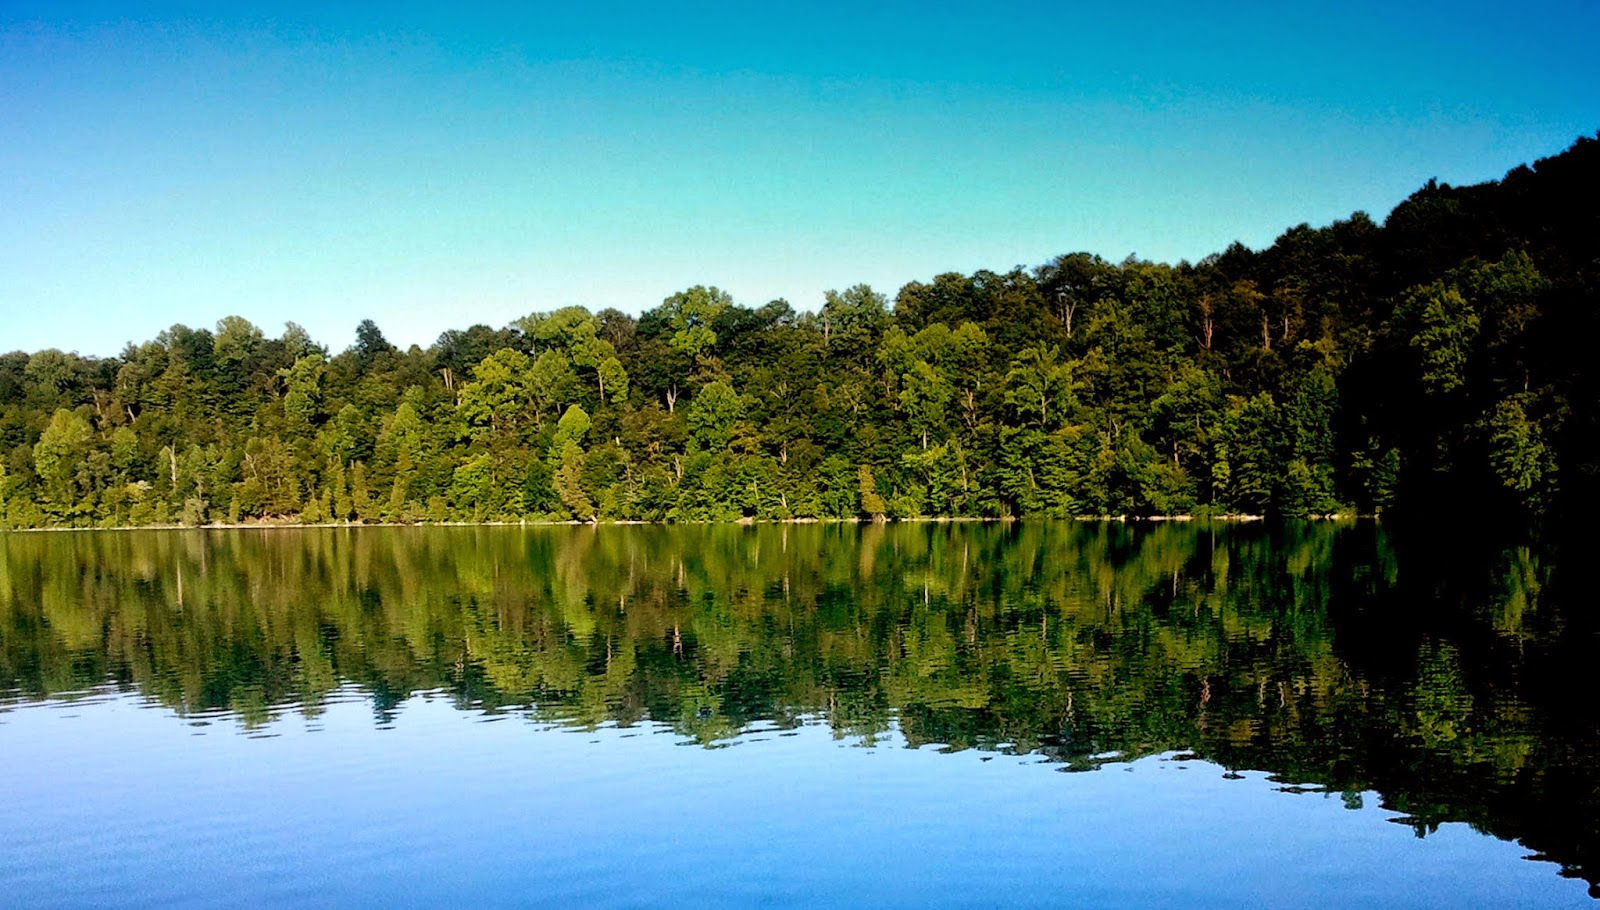 |
| Green Lake in summer (Tannis McCartney, 2012) |
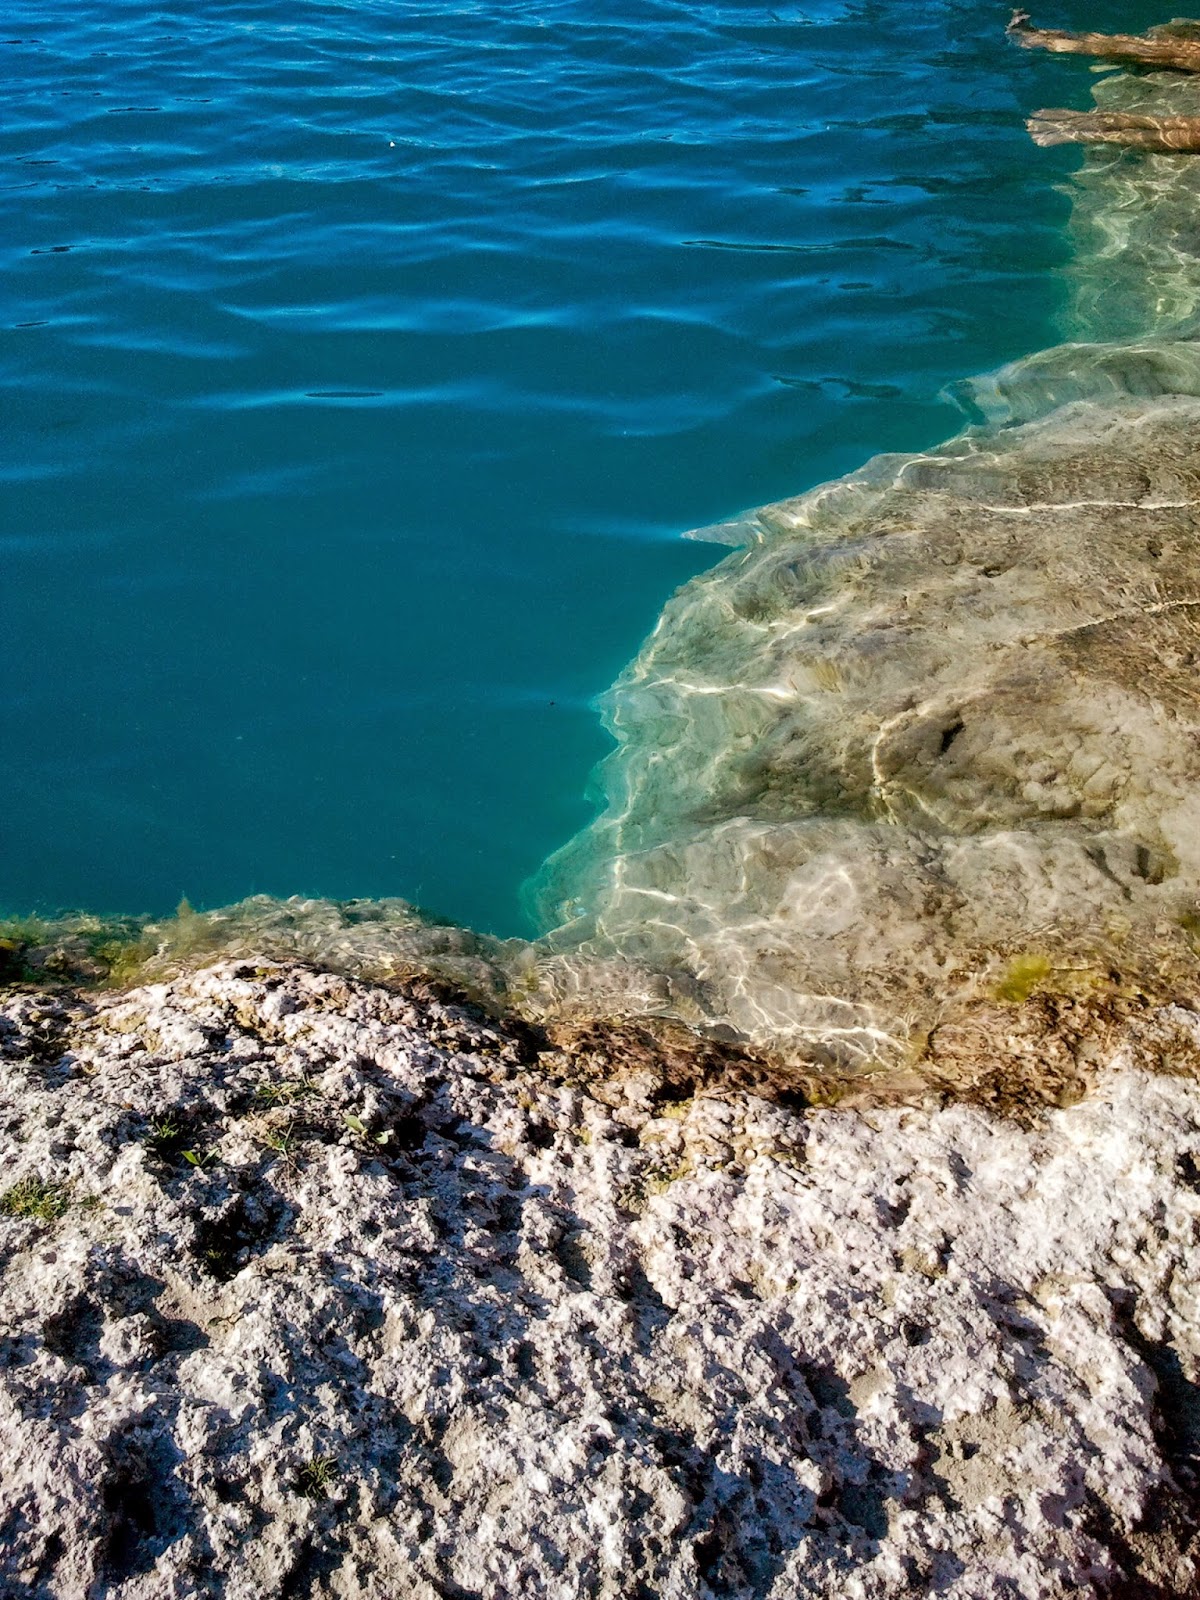
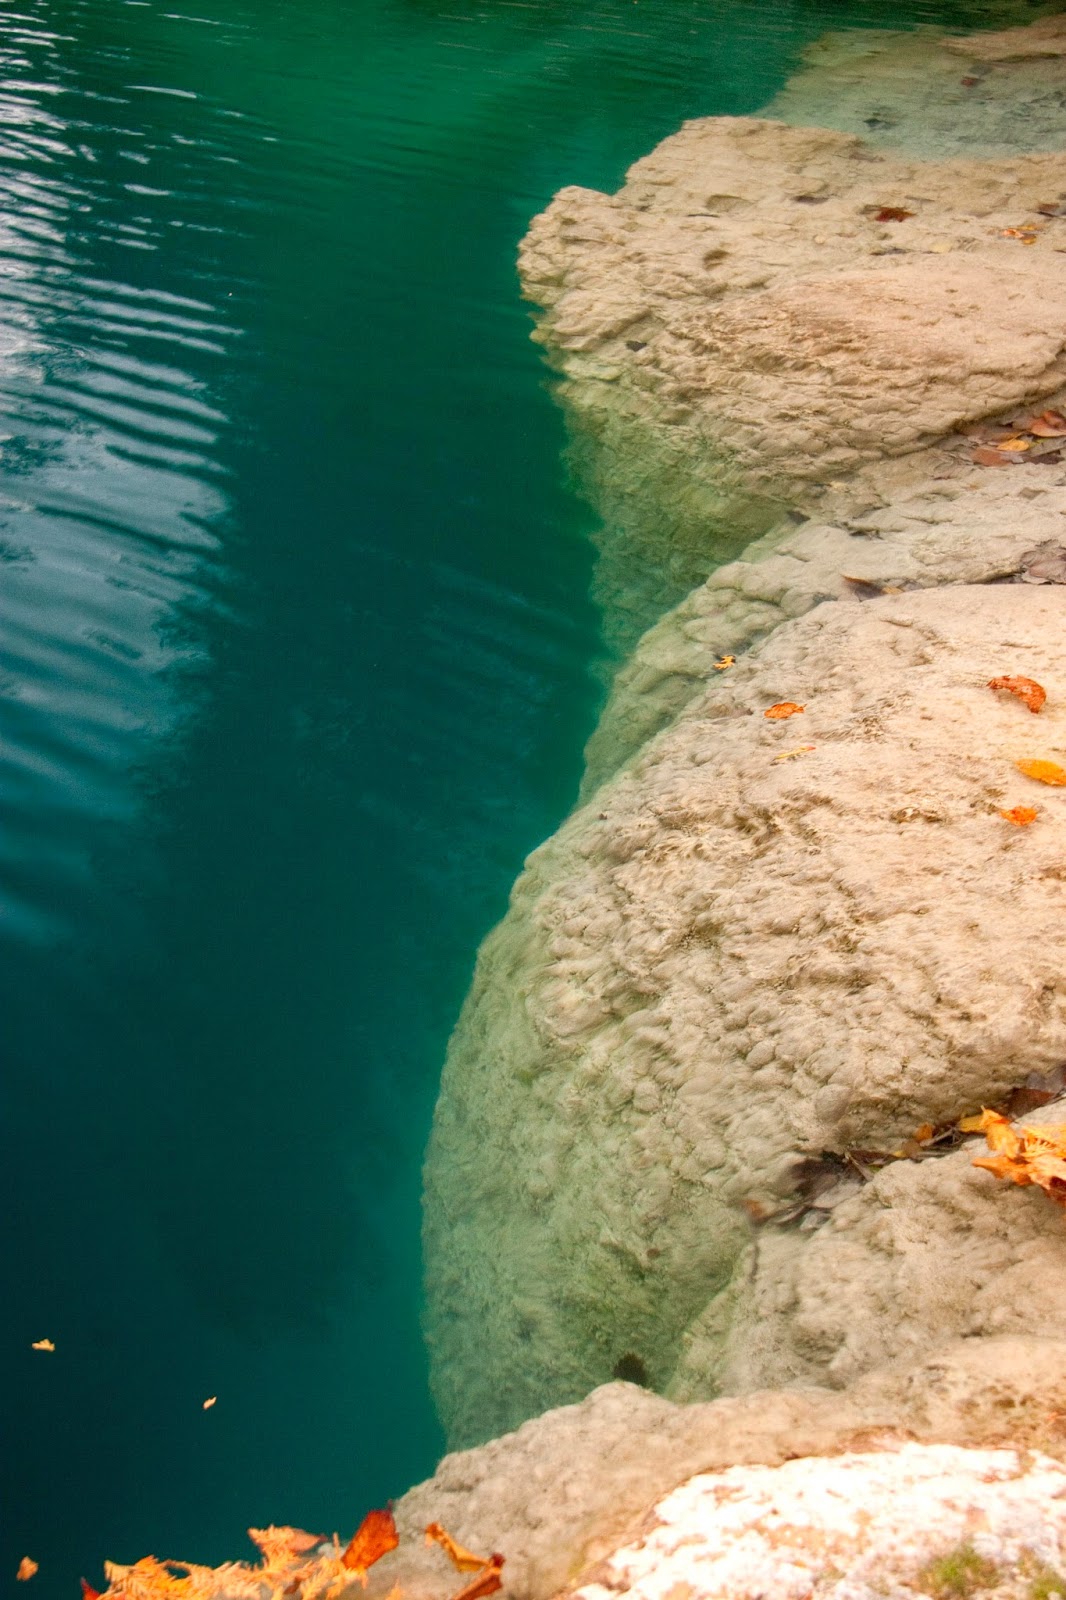
The lakes are surrounded by trees, but that's not how Green Lake (and the park) got its name. The name comes from the green colour of the water, which is a result of the the dissolved minerals brought into the lakes by rain and snow (particularly magnesium and calcium).
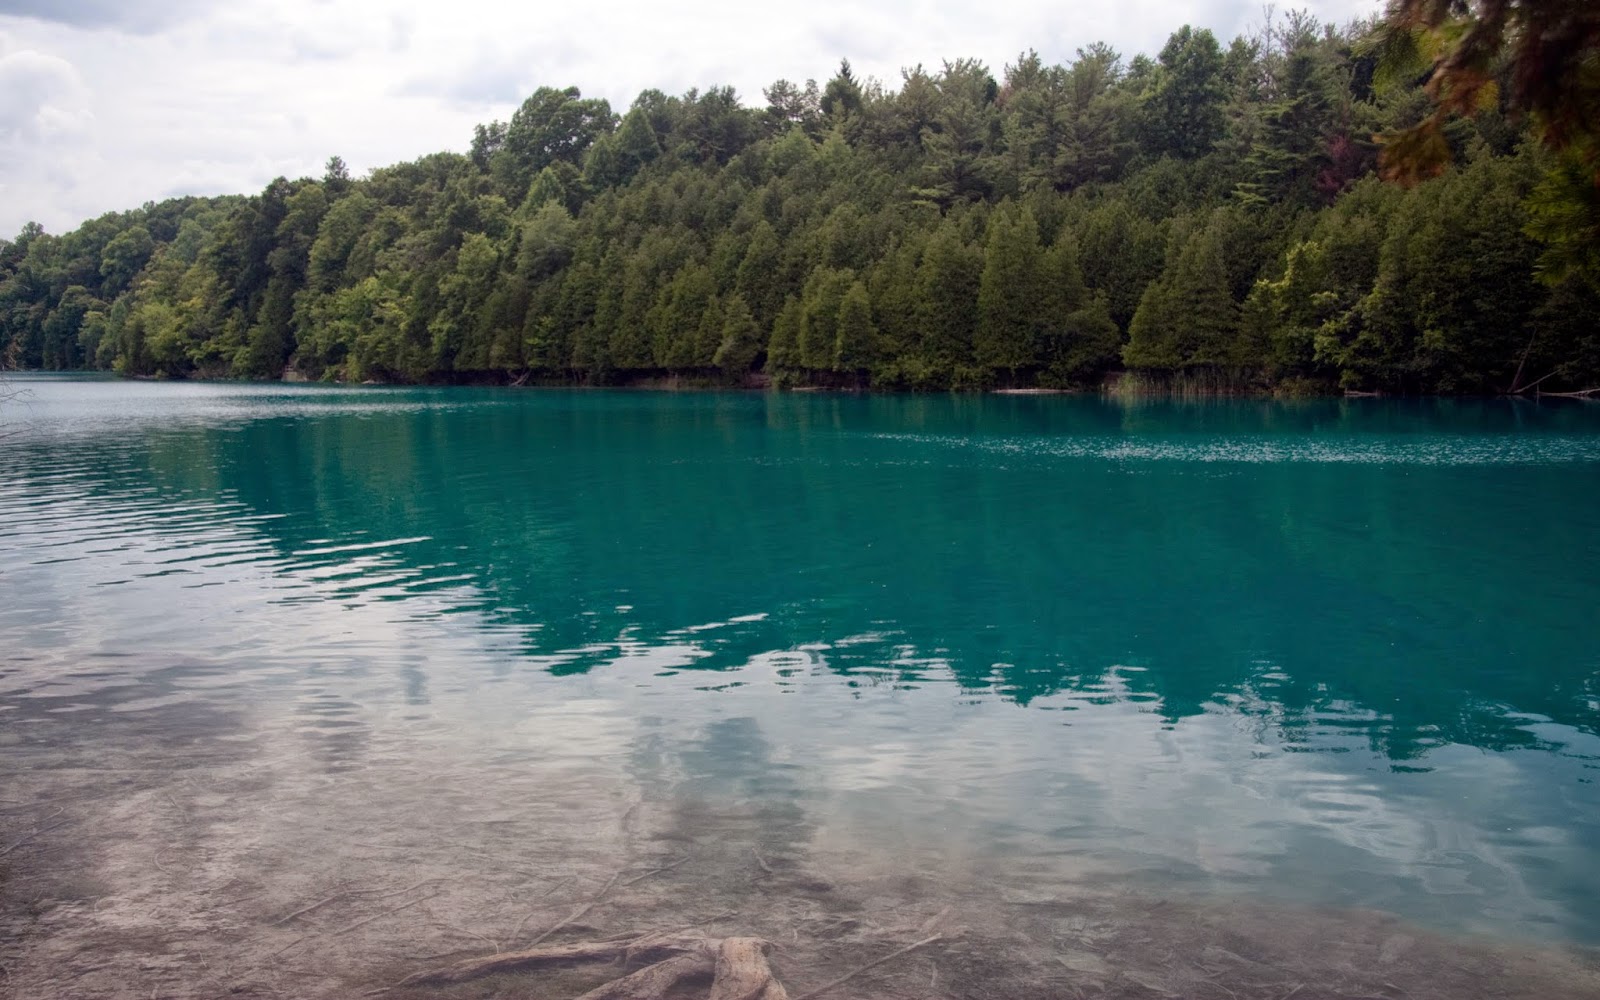 |
| The distinctive colour that gives Green Lake its name (Tannis McCartney, 2014) |
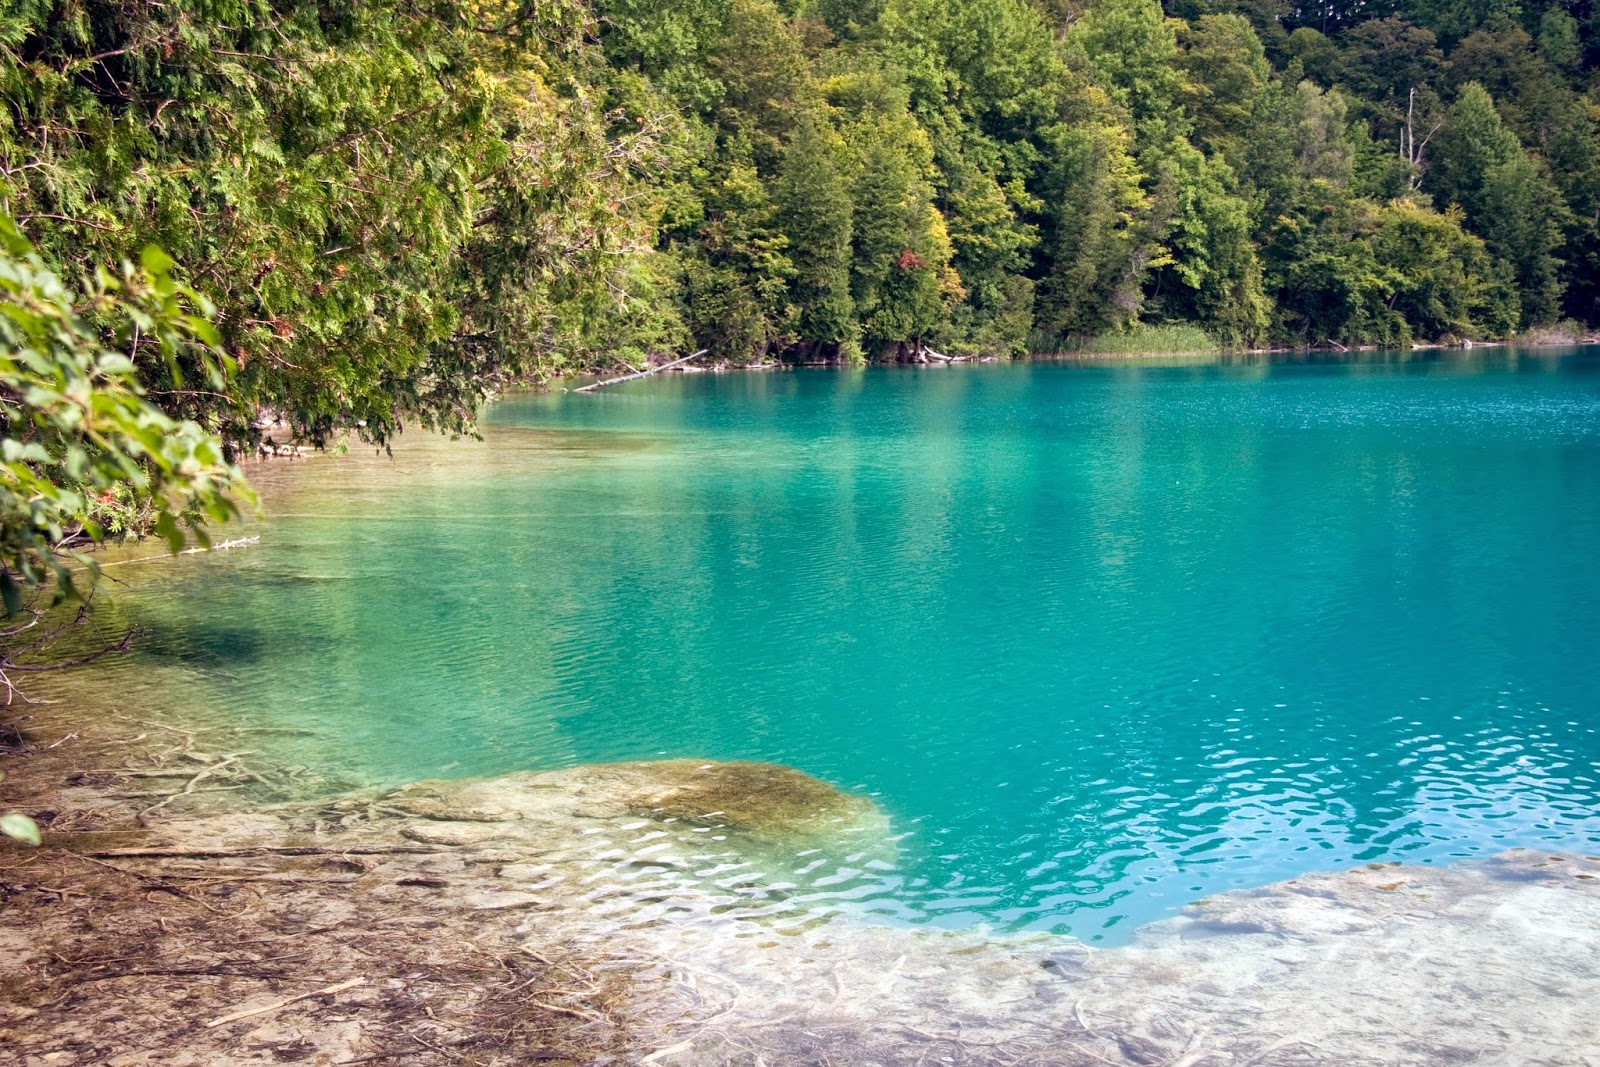 |
| The distinctive colour that gives Green Lake its name (Tannis McCartney, 2014) |
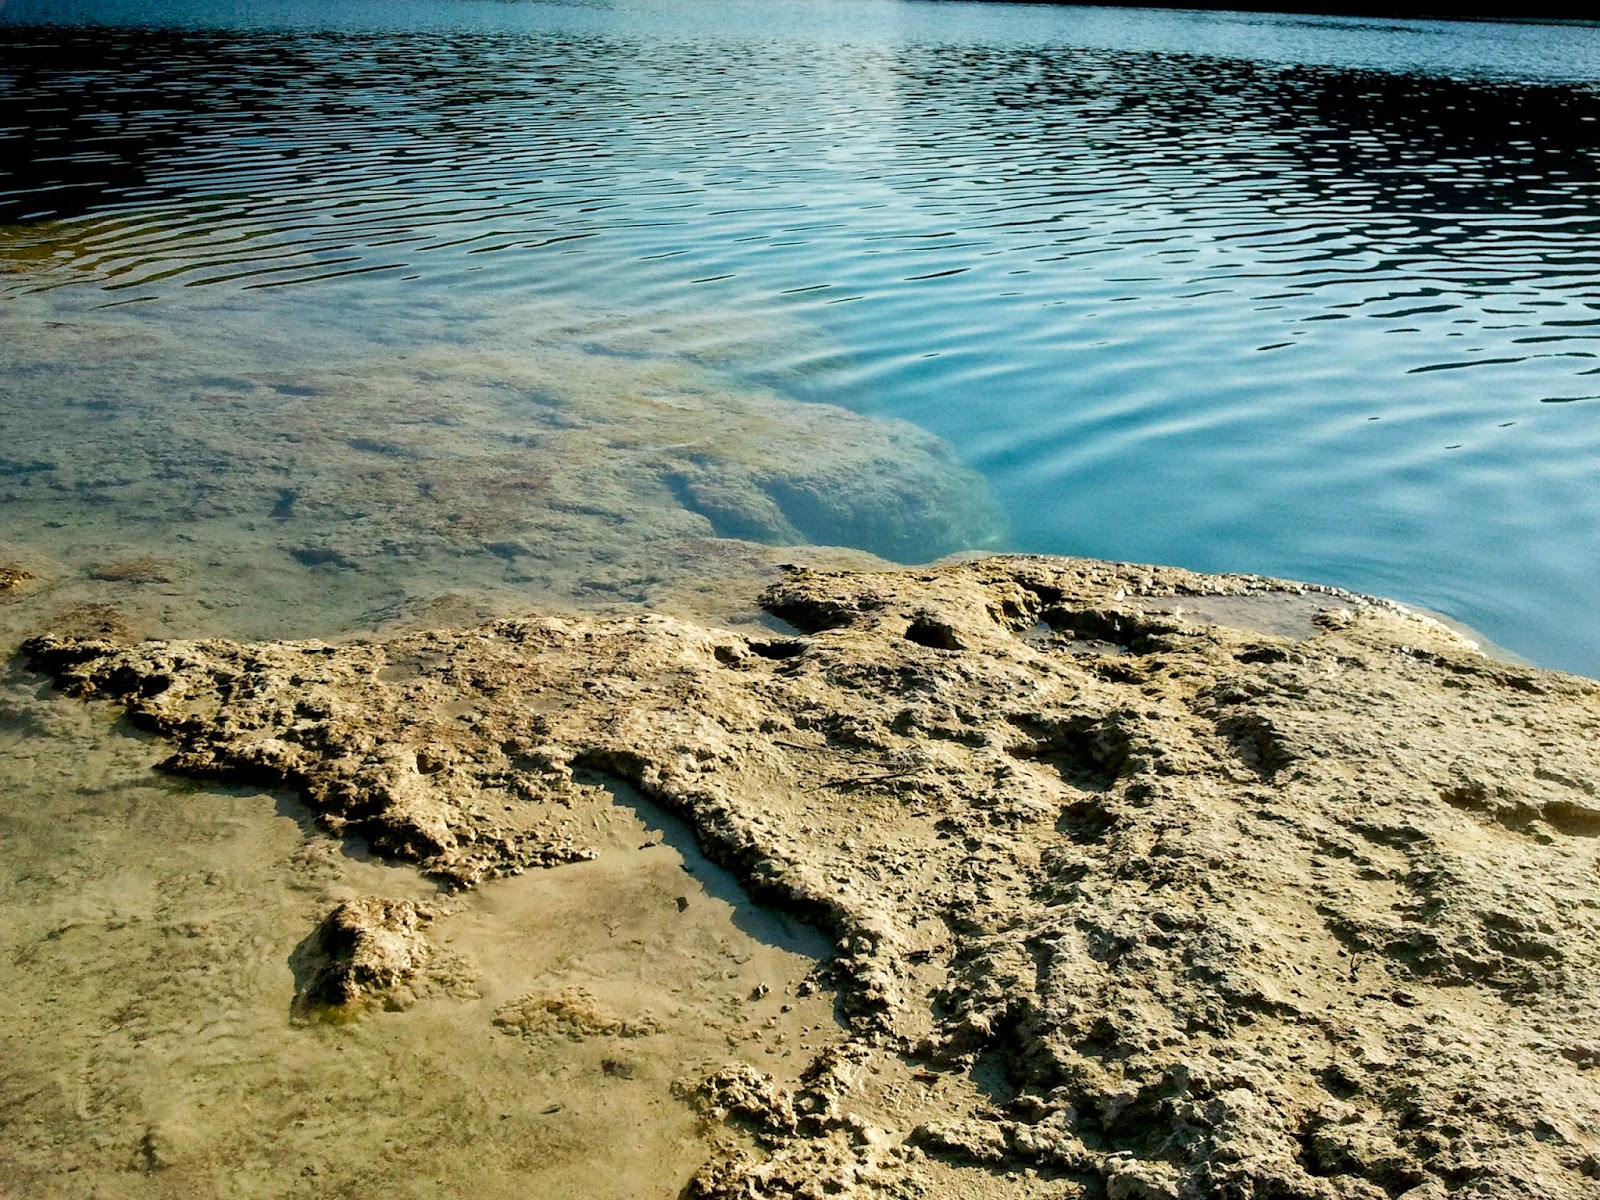
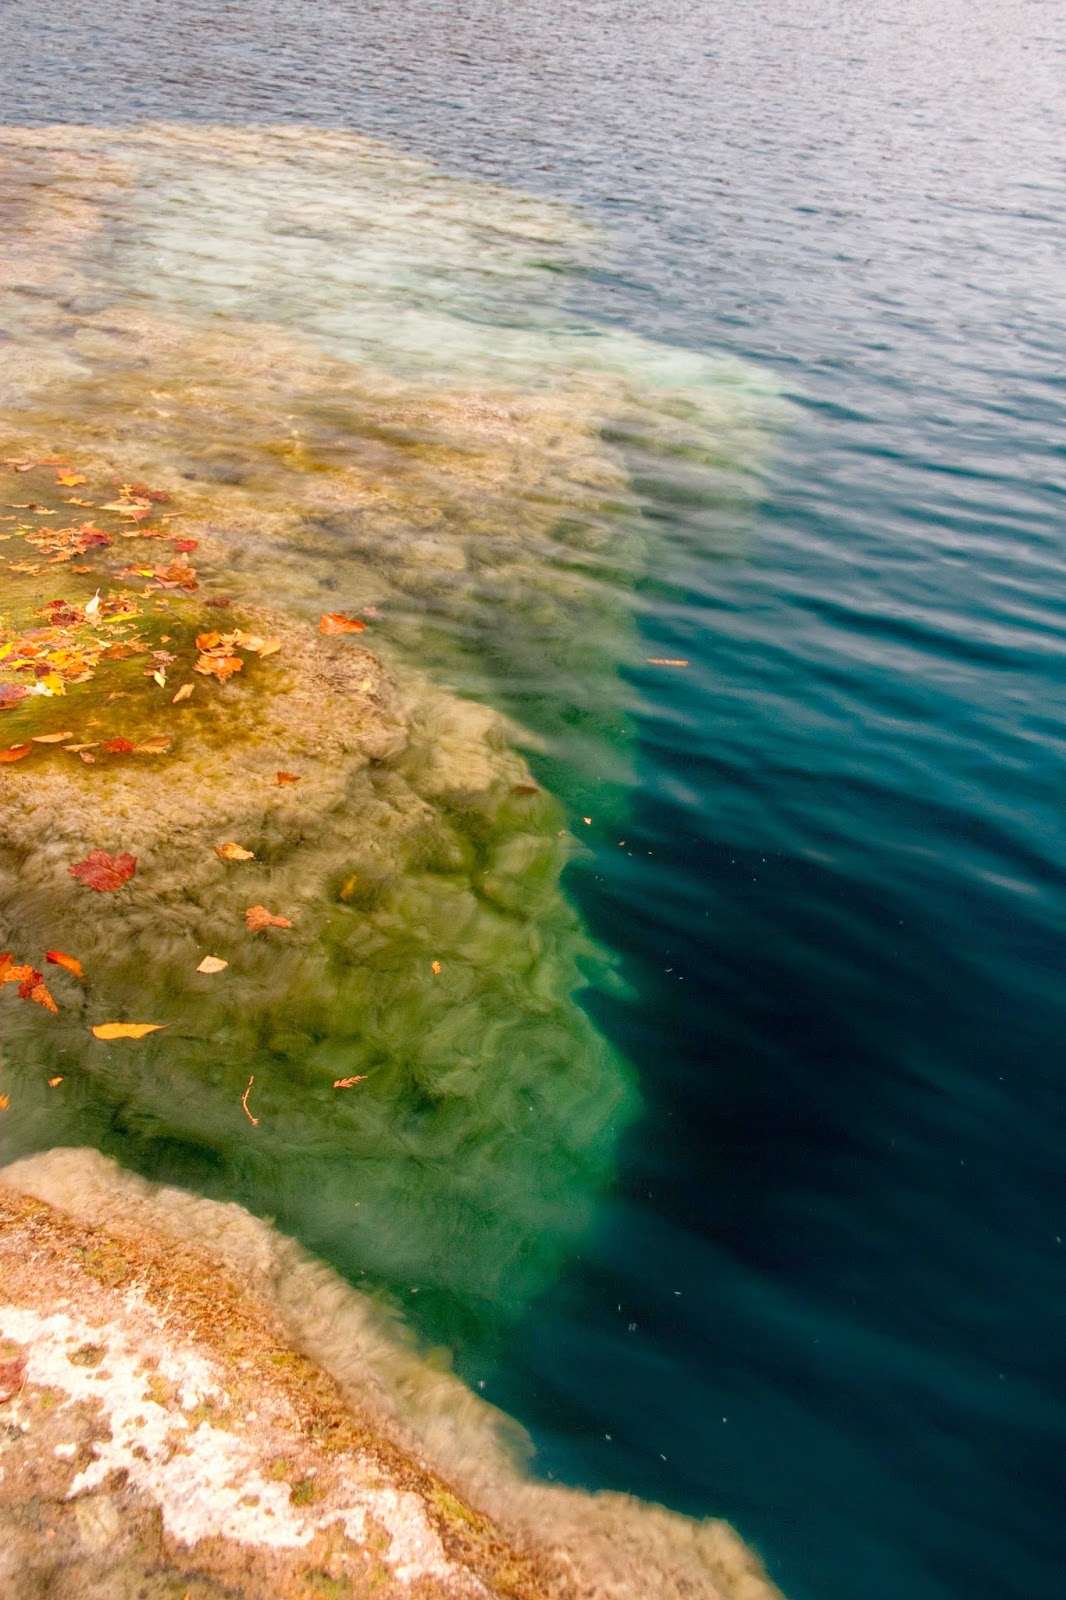
The reefs of Green Lake are algal reefs, although there is calcium carbonate found in the lake too, in a type of mud called marl. Cyanobacteria mats extend into the lake from the shoreline. If you want a more detailed and scientific discussion about the lake, I recommend the paper, by Thompson and others, cited at the bottom of this post.
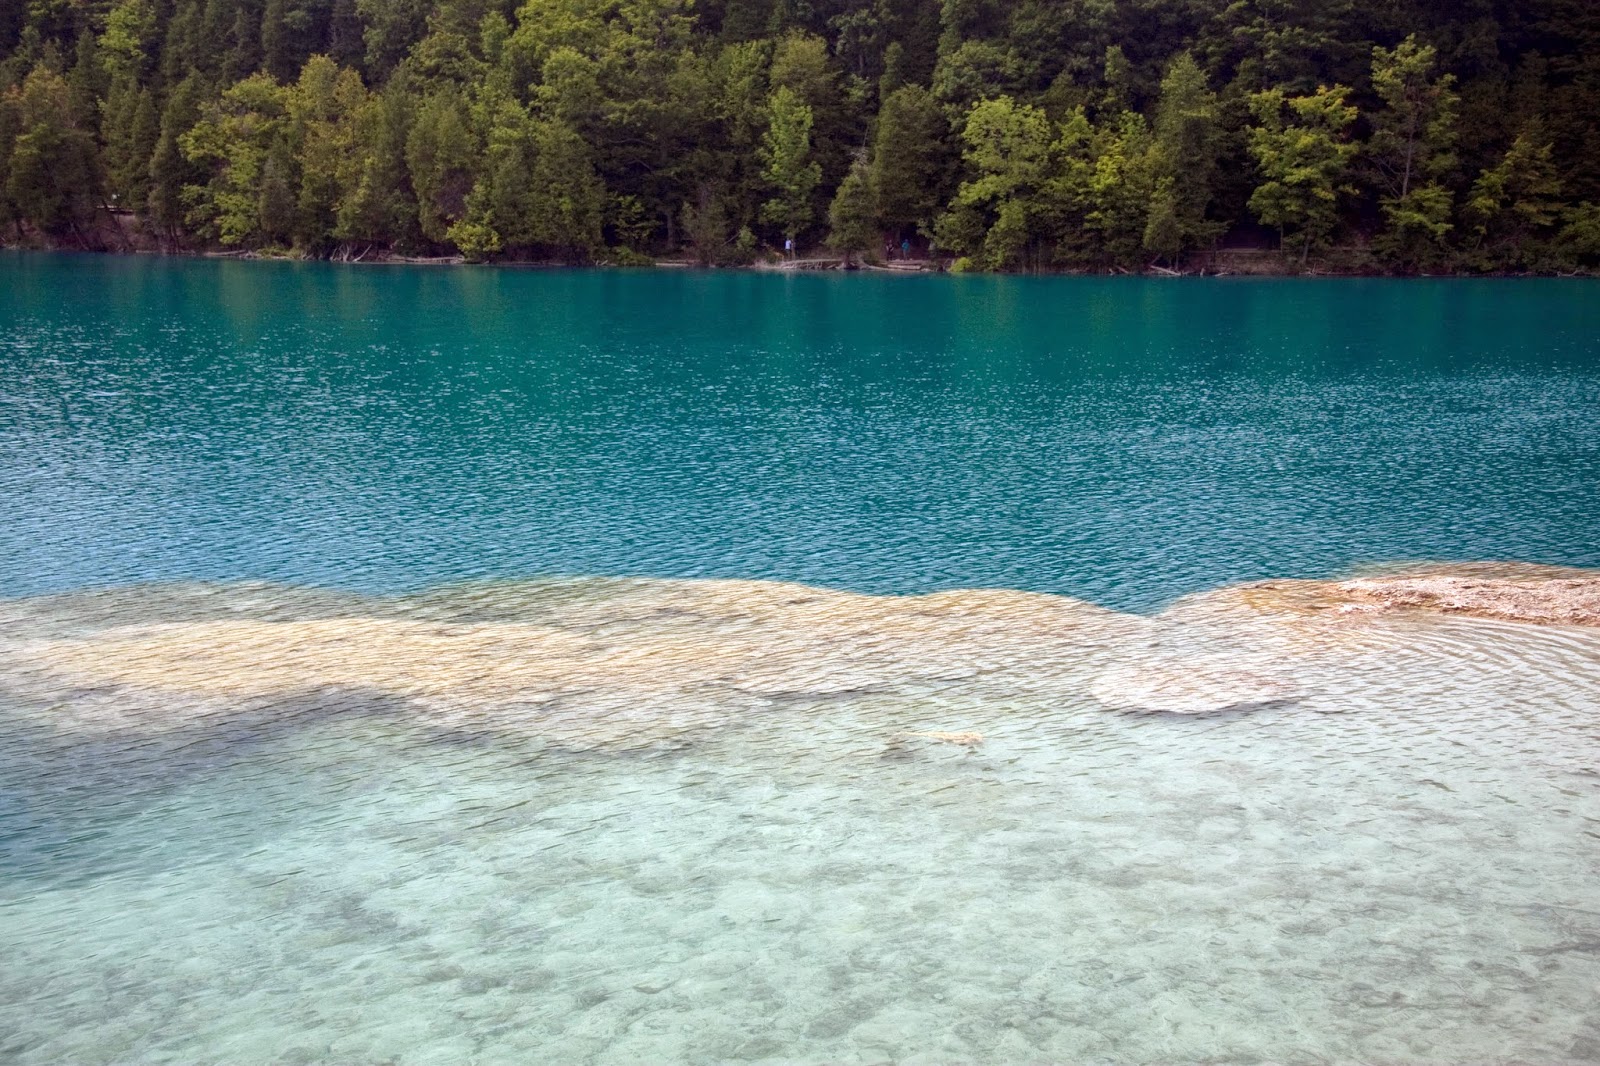 |
| Microbial mat extending into the lake (Tannis McCartney, 2014) |
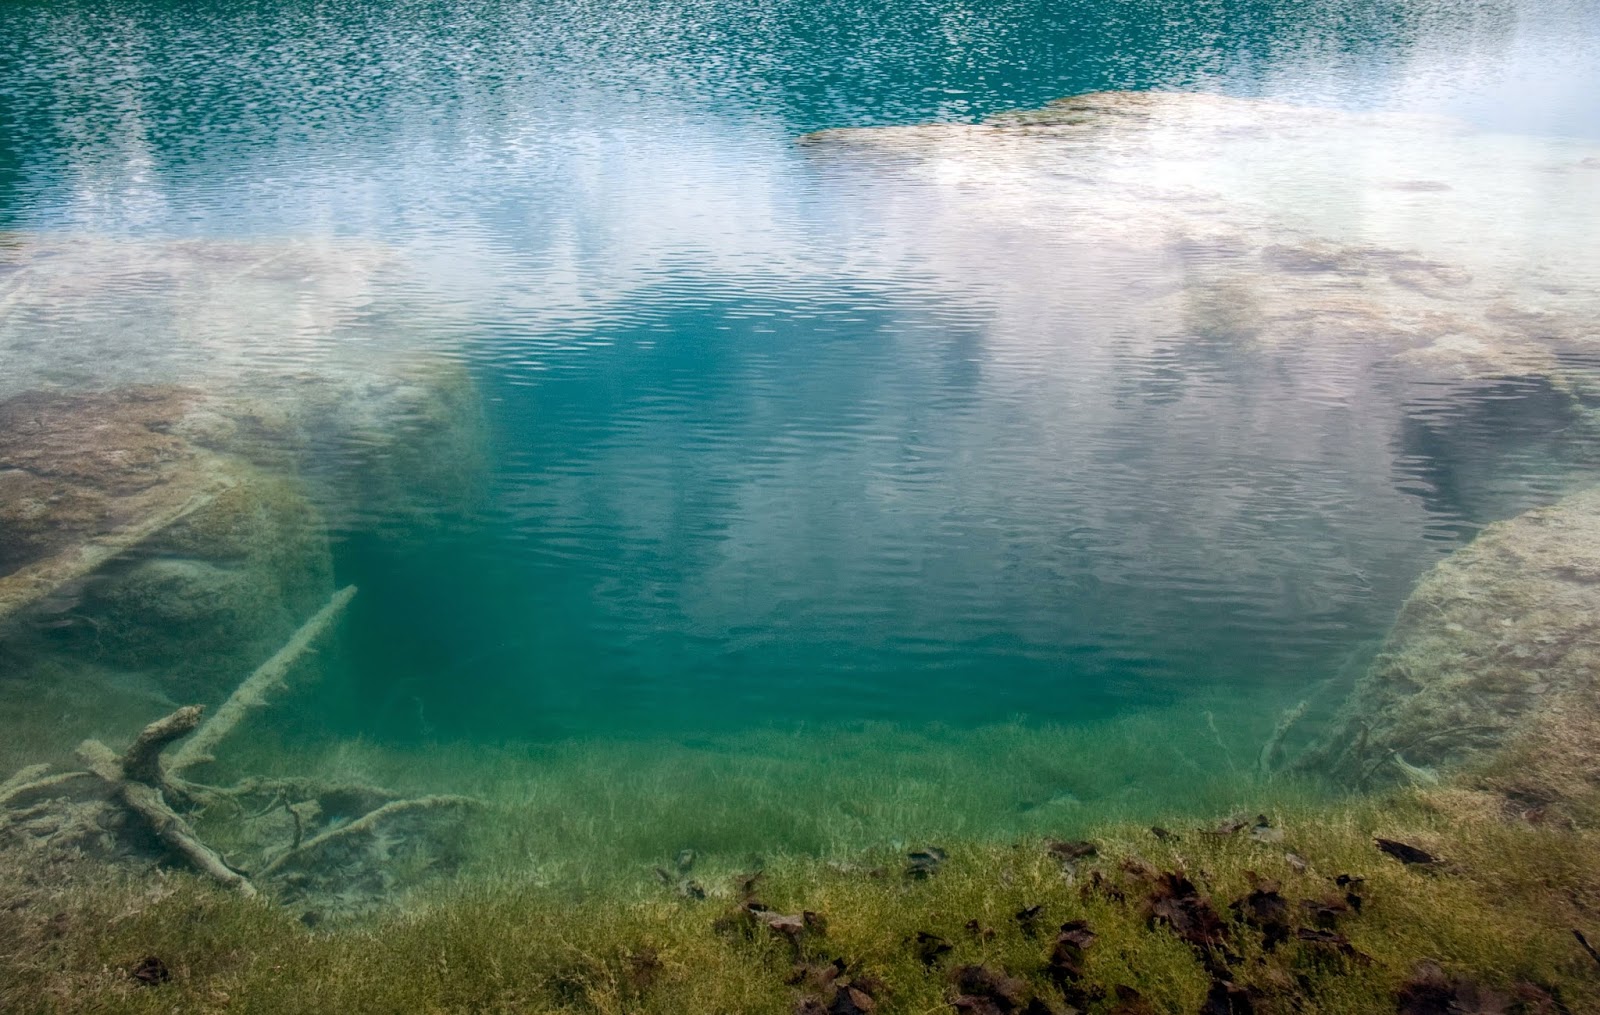
 |
| "Reef" at Dead Man's Point (Tannis McCartney, 2012) |
 |
When the lake is low, you can step out onto the tops of the reef.
This is permitted, but going in the water isn't. (Tannis McCartney, 2012) |
 |
| Tannis McCartney, 2014 |
 |
| Tannis McCartney, 2012 |
 |
| Tannis McCartney, 2012 |
 |
| Tannis McCartney, 2012 |
Access to the reefs is restricted, in order to protect them, but you can watch a video taken with an ROV (remote-operated-vehicle) here: (
The Underwater World of Green Lakes). The video is part of the research by
Dr. Mark Teece and his biogeochemstry group at SUNY-ESF, which is right next door to SU.
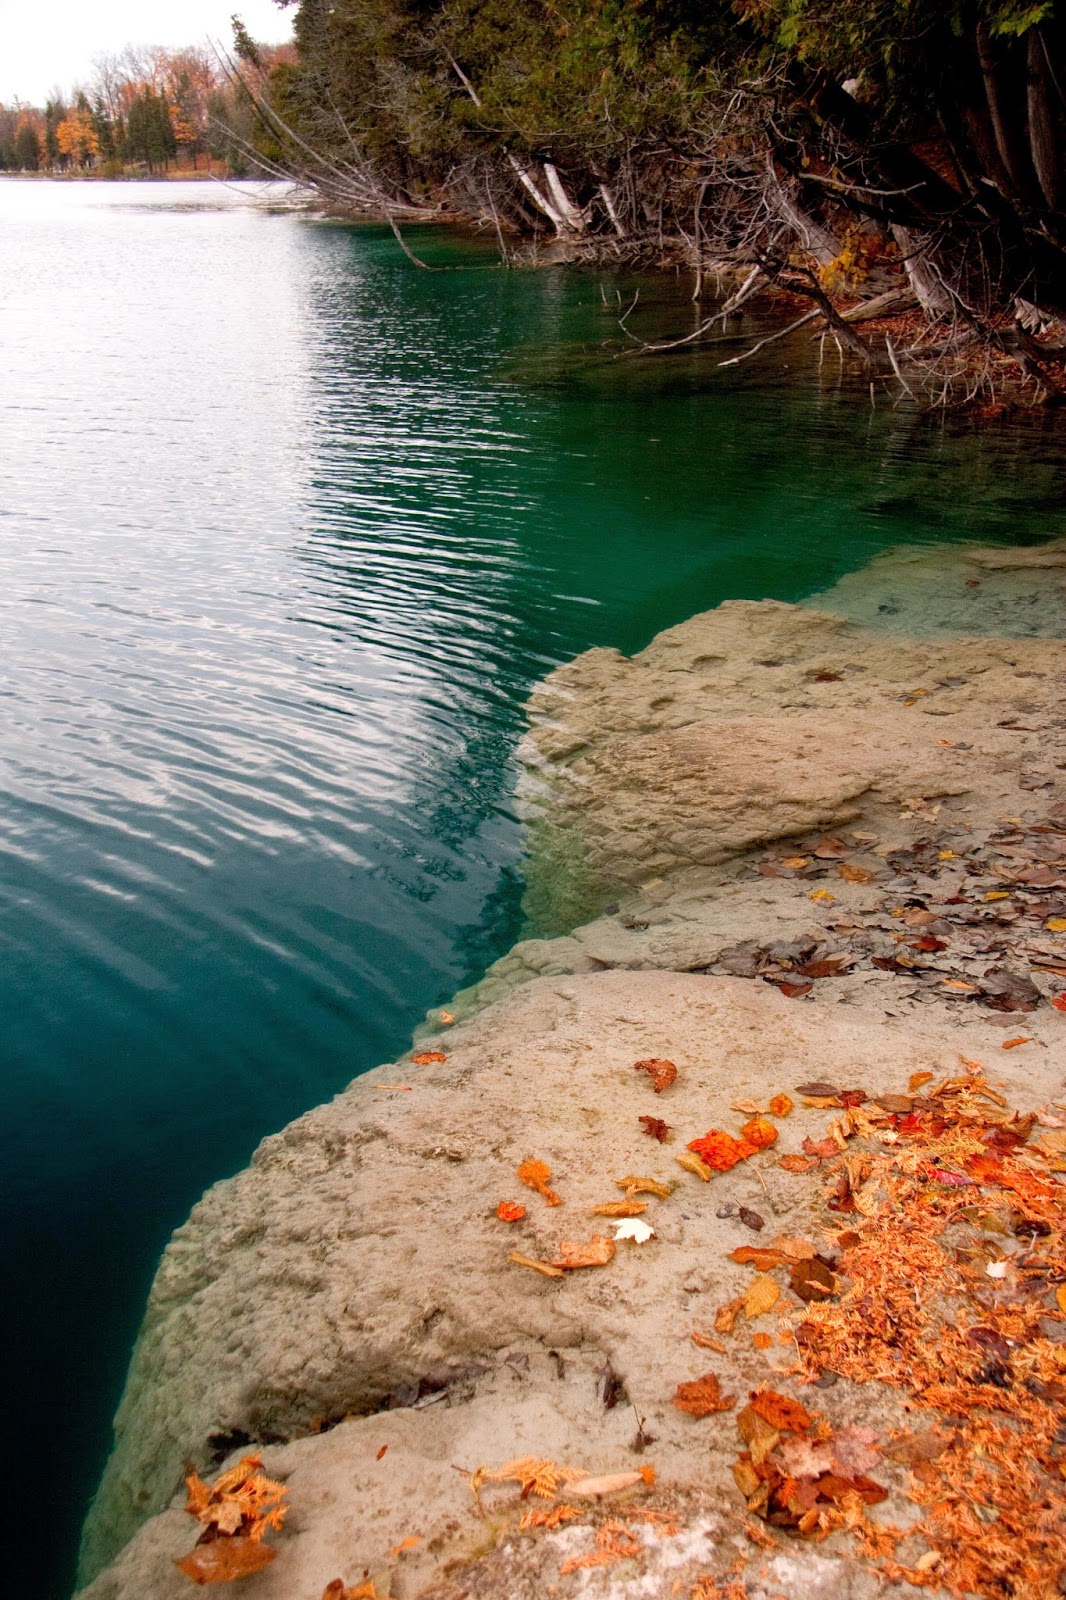
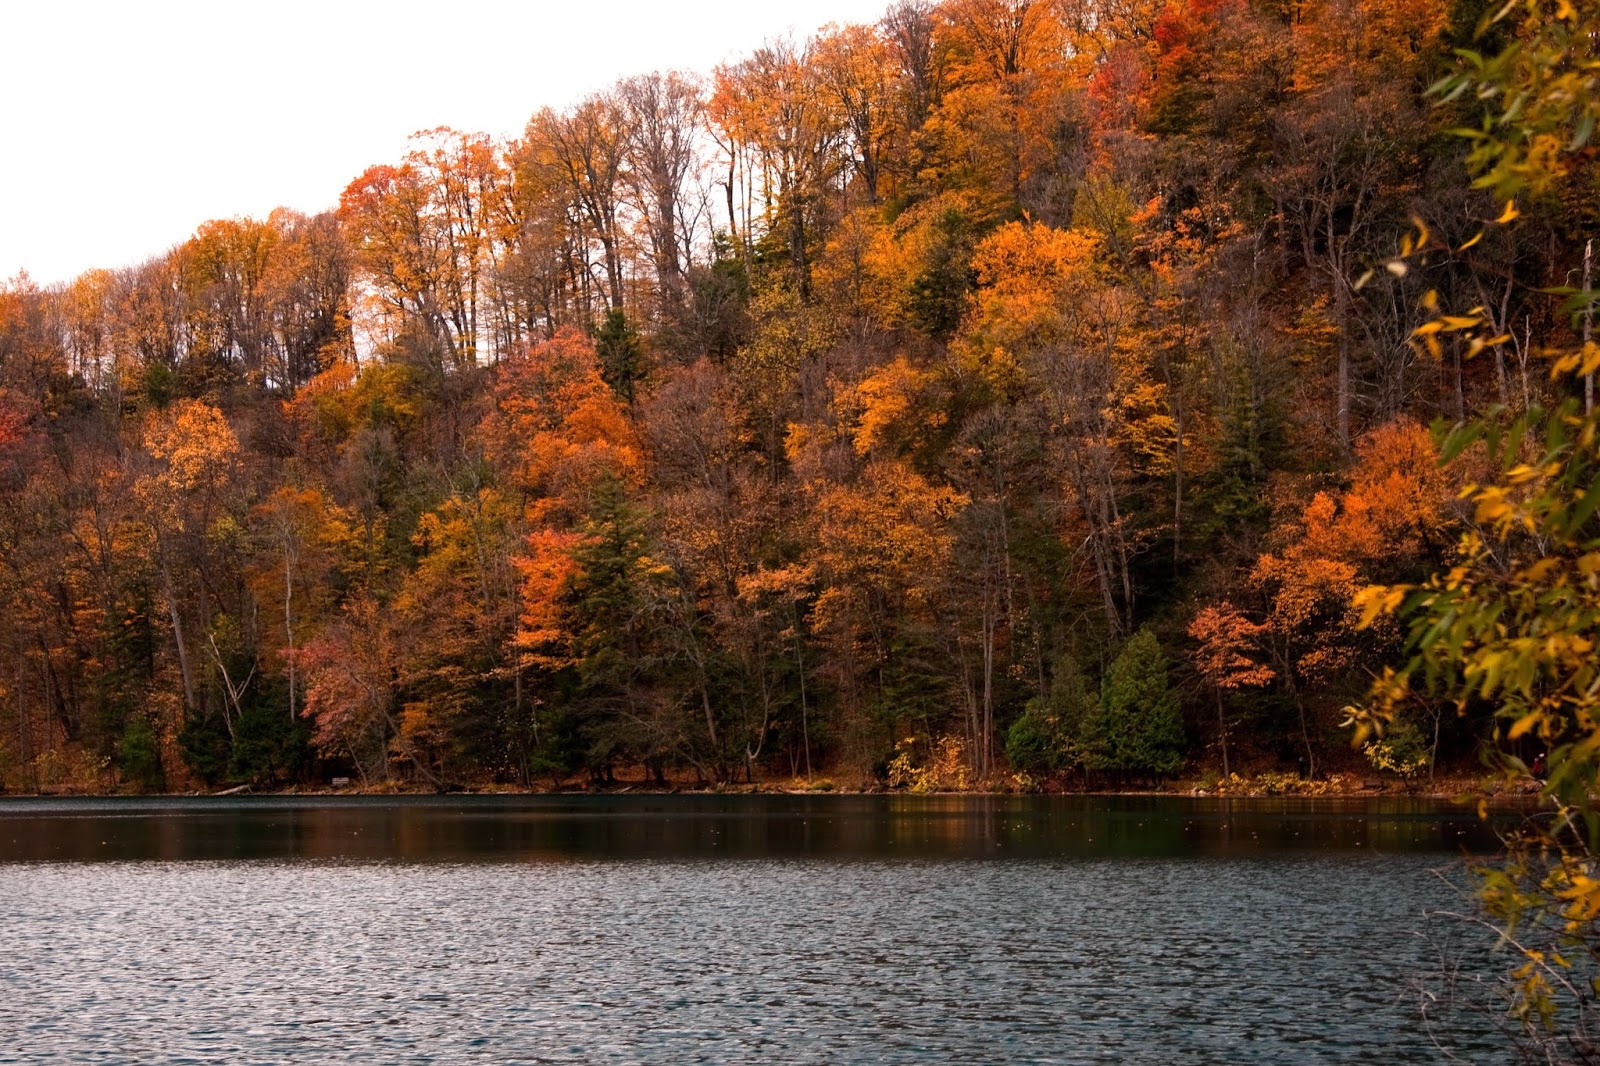
Green Lakes State Park is not just for summer cookouts and swimming. In the autumn it is a great place to see the changing leaves in the old-growth forests, and the
trails are popular with cross-country skiers and snowshoers in the winter.
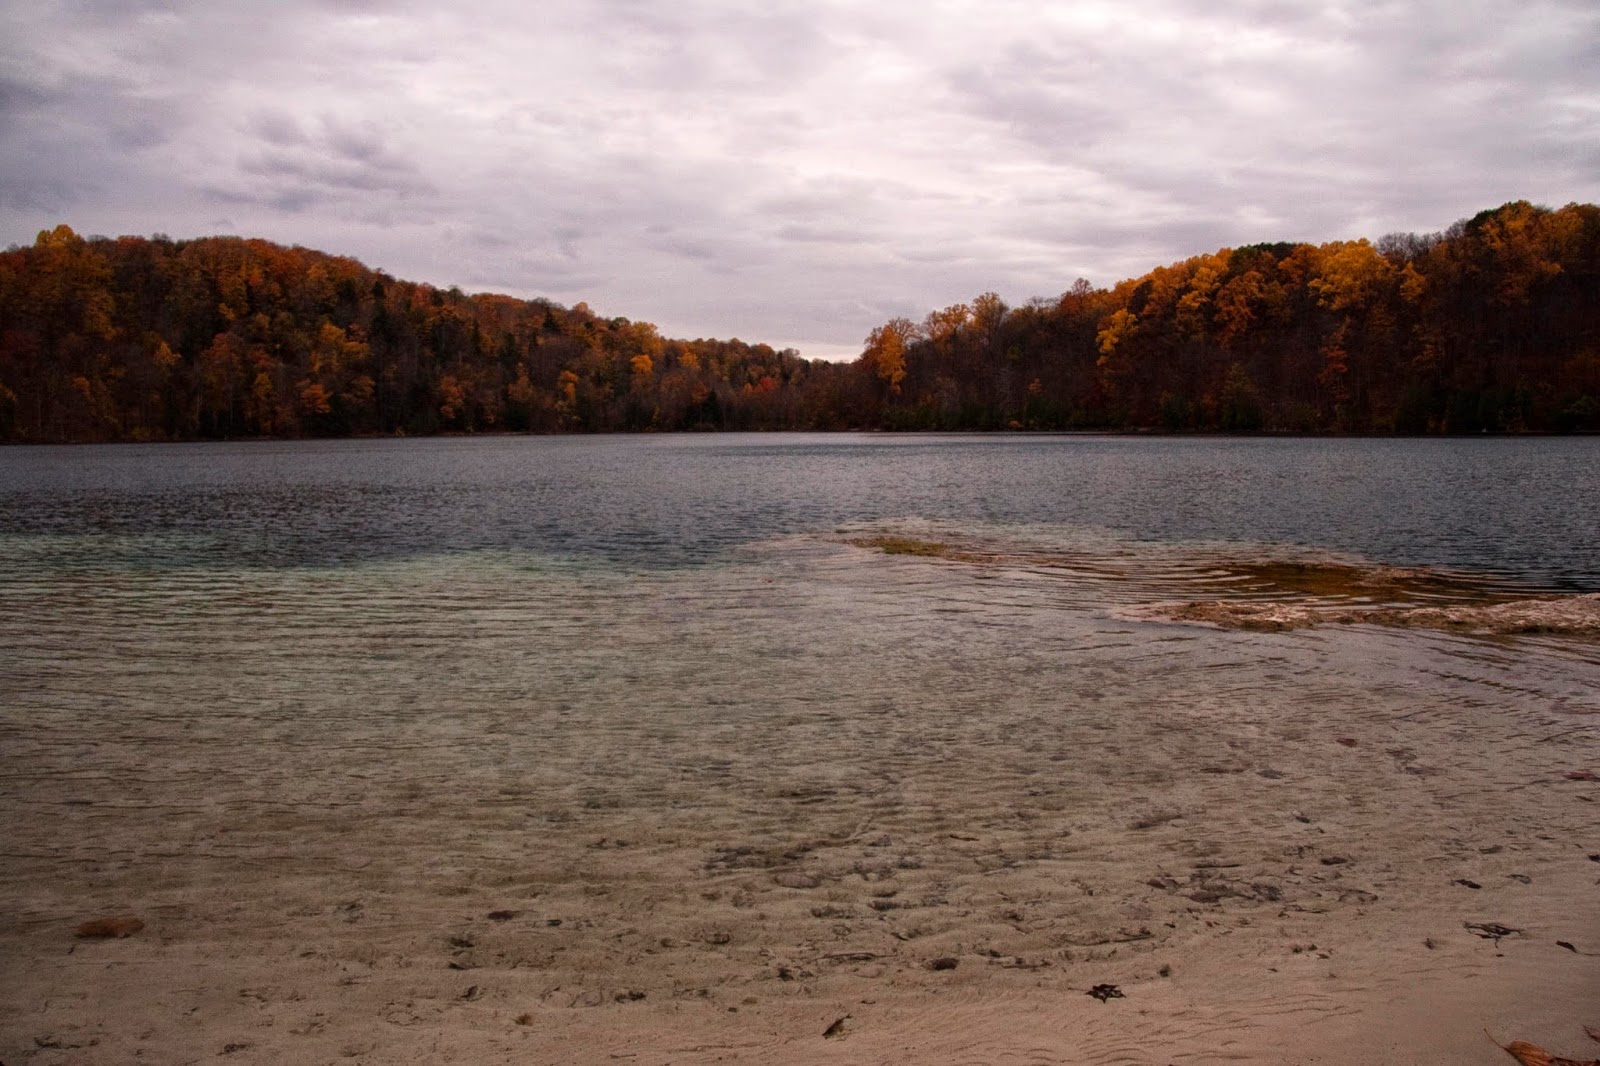 |
| Green Lake in the autumn (Tannis McCartney, 2012) |
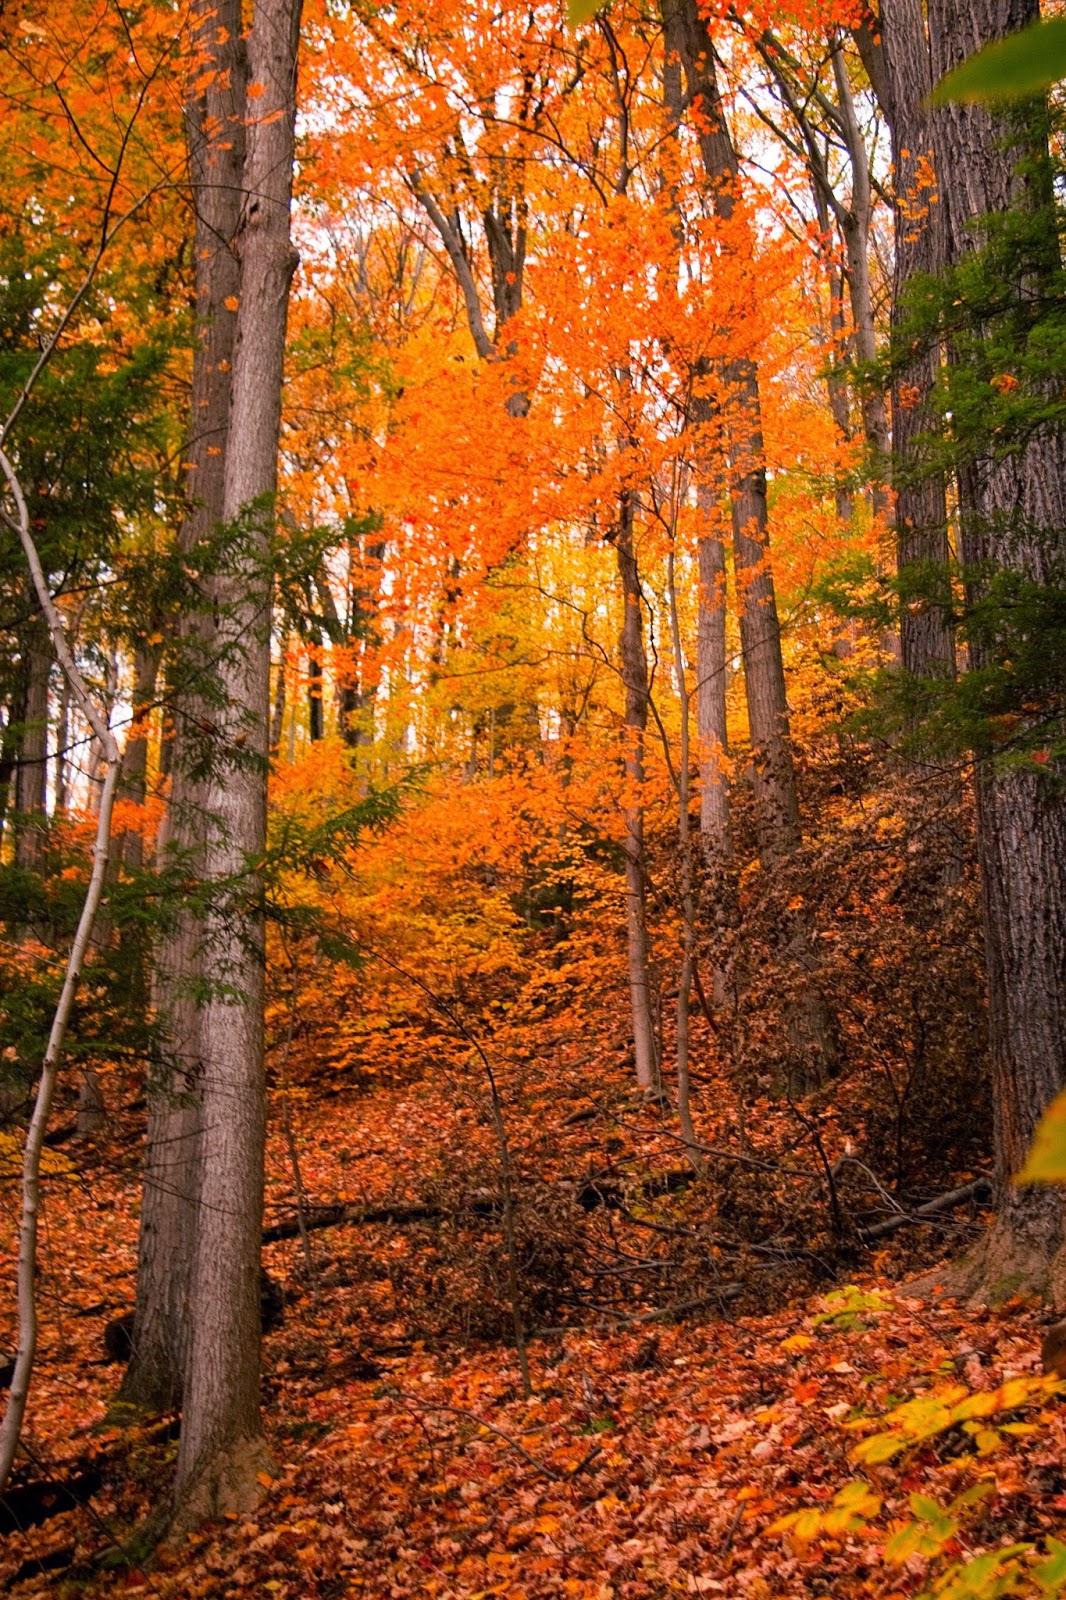
 |
| Green Lake in the autumn (Tannis McCartney, 2012) |
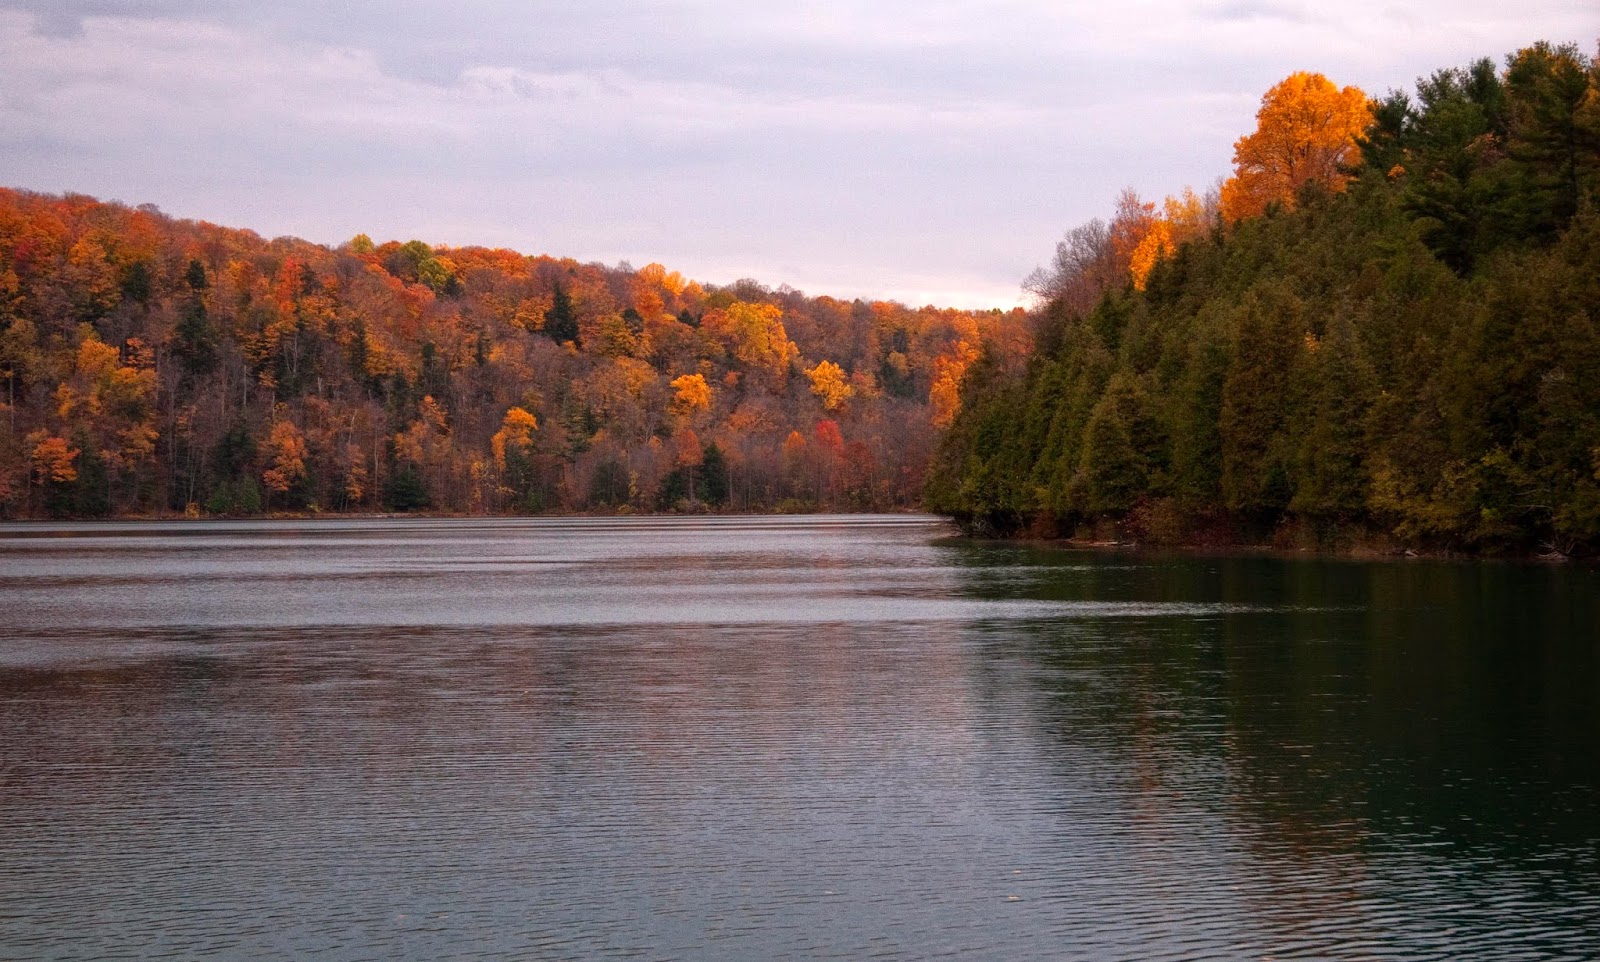
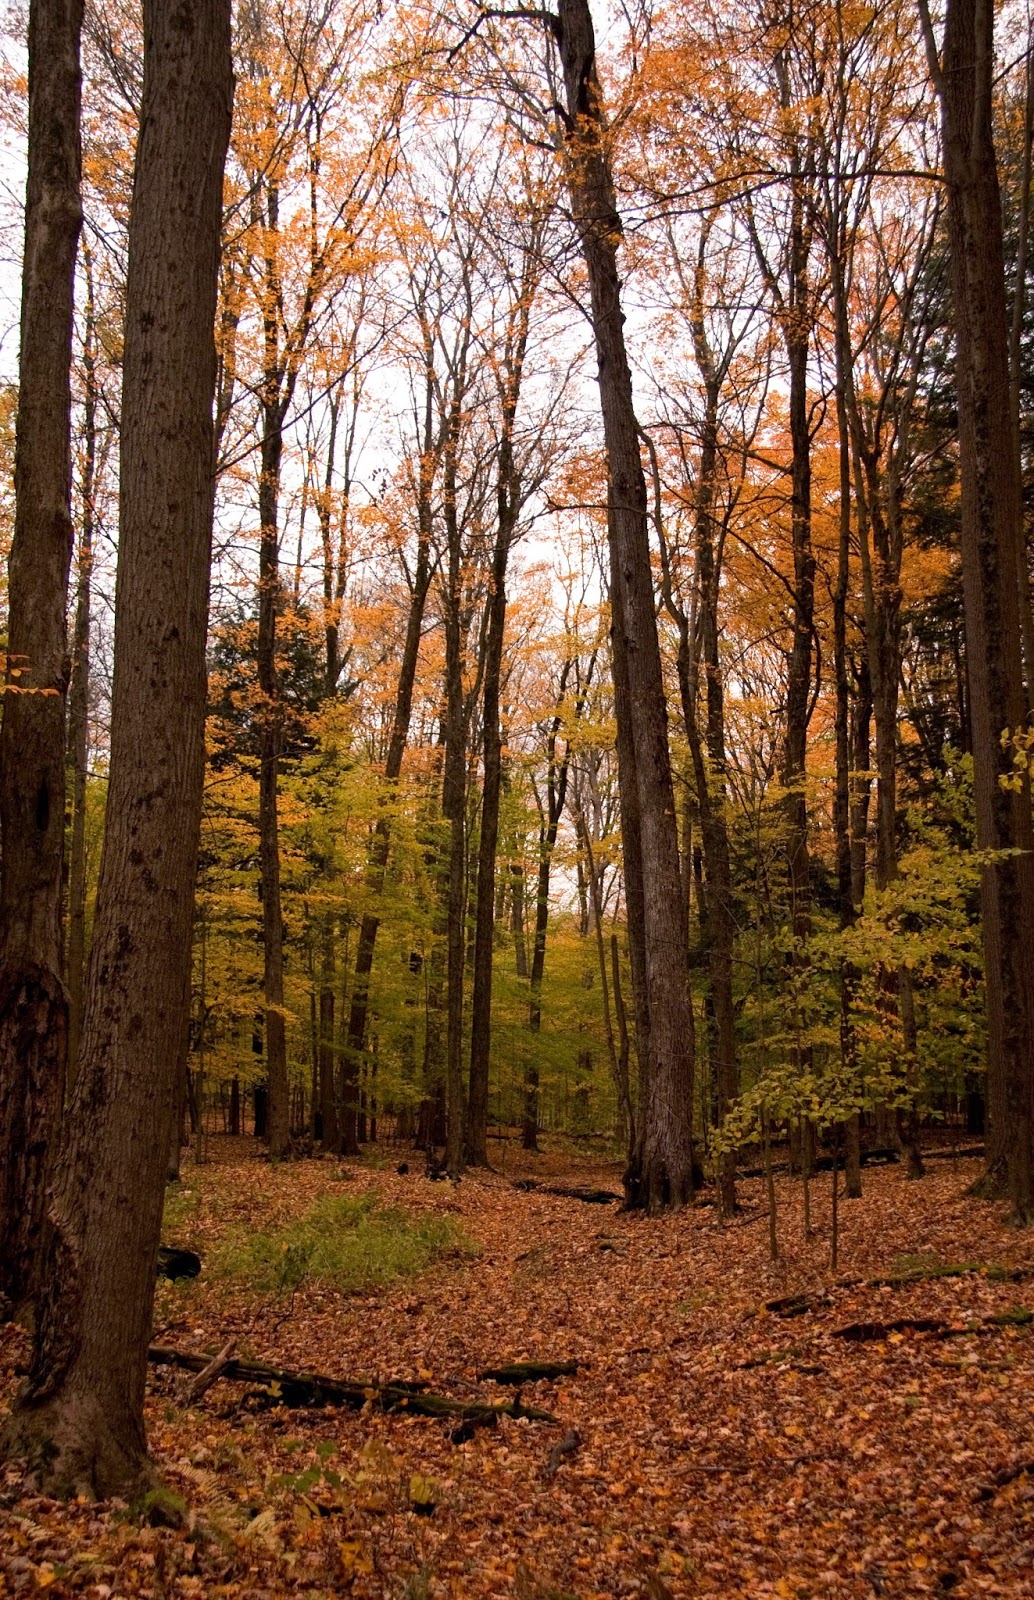
 |
| Round Lake in the autumn (Tannis McCartney, 2012) |
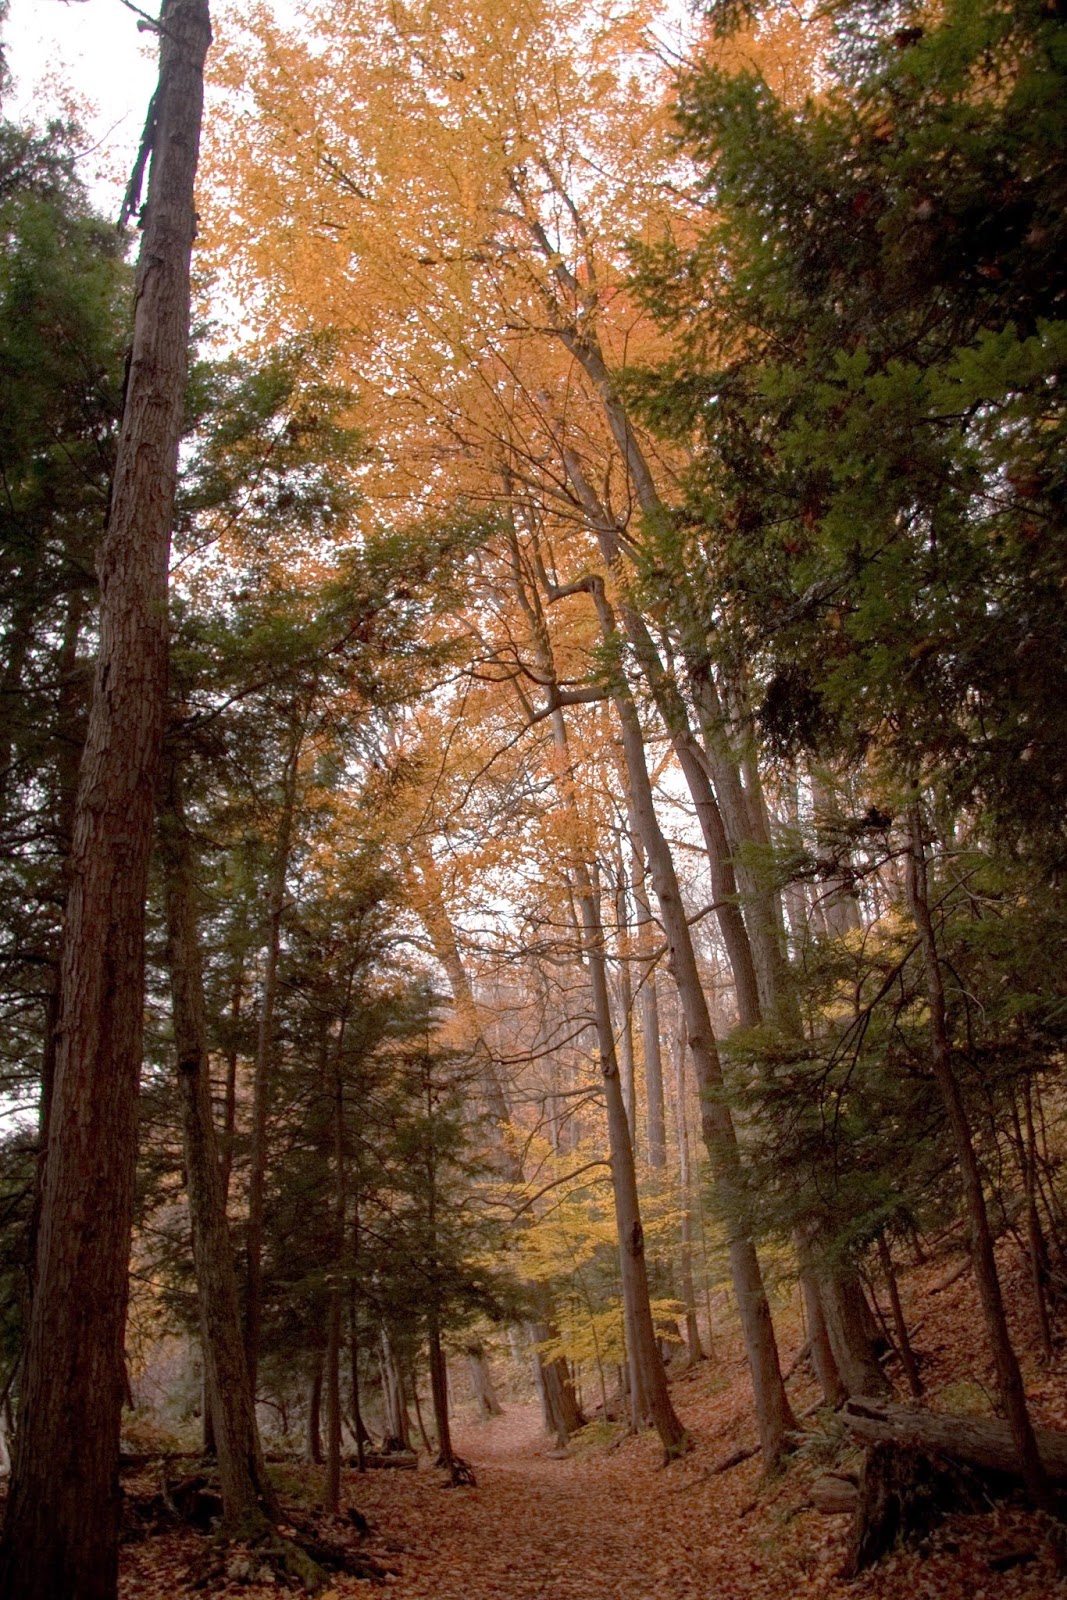
 |
| Tannis McCartney, 2012 |
 |
| Tannis McCartney, 2012 |
 |
| Tannis McCartney, 2012 |
References:
Thompson, J., Ferris, F., and Smith, D., 1990, Geomicrobiology and sedimentology of the mixolimnion and chemocline in Fayetteville Green Lake, New York: Palaios, v. 5, no. 1, p. 52–75.